
Make Fact-Based Decisions, Solve Problems & Identify Opportunities with Clear Reporting & Metrics
With Smarten eCommerce Analytics for Shopify, users gain insight into data in a unique and meaningful way! The app provides the value of analytics integration and fact-based decision-making.
Users enjoy seamless login and registration. Within minutes users will see Shopify eCommerce data in Smarten with prebuilt analytics templates. Choose from one of three flexible pricing plans (Silver, Gold and Platinum) to suit your needs.
Accredited by Gartner and recognized for its intuitive, easy-to-use analytics, Smarten offers stunning visualization, dynamic charts and graphs, BI tools, and key performance indicators (KPIs) metrics to help you sustain a competitive edge.
Smarten goes far beyond Visual Analytics tools that simply monitor data. The Smarten app reimagines analytics with out-of-the-box reports and dashboards that dive deep into data, drill down and through data and allow users to interact with data to make data-driven decisions.
Smarten eCommerce Analytics for Shopify provides value out-of-the-box with vital eCommerce dashboards and reports to manage business health and identify opportunities to expand and grow your eCommerce business. It provides sales reports, sales trends and sales contribution, advanced key performance indicators (KPIs) and analytics to reveal Customer Lifetime value (LTV), Customer Cohorts, Customer Loyalty and Product Cross Sell.
The Value Proposition
- Integrated Analytics for Every Business User
- Improved Customer Focus and Understanding
- NO Integration or Development Efforts Required
- Software as a Service (SaaS) Hosted Access
- Accessible, Easy, Clear: Pre-Built Reports and Dashboards
Real Business Use Cases, Real Business Results
Customer Lifetime Value
Problem: The business cannot afford to create and sustain campaigns for customer segments that reap few benefits.
Solution: SmartenApps offers clear insight to target groups for marketing with understanding of demography and characteristics for easy targeting. It reflects spending for a period of time, customer type or group so your business can focus on the right targets and plan for better return on investment.
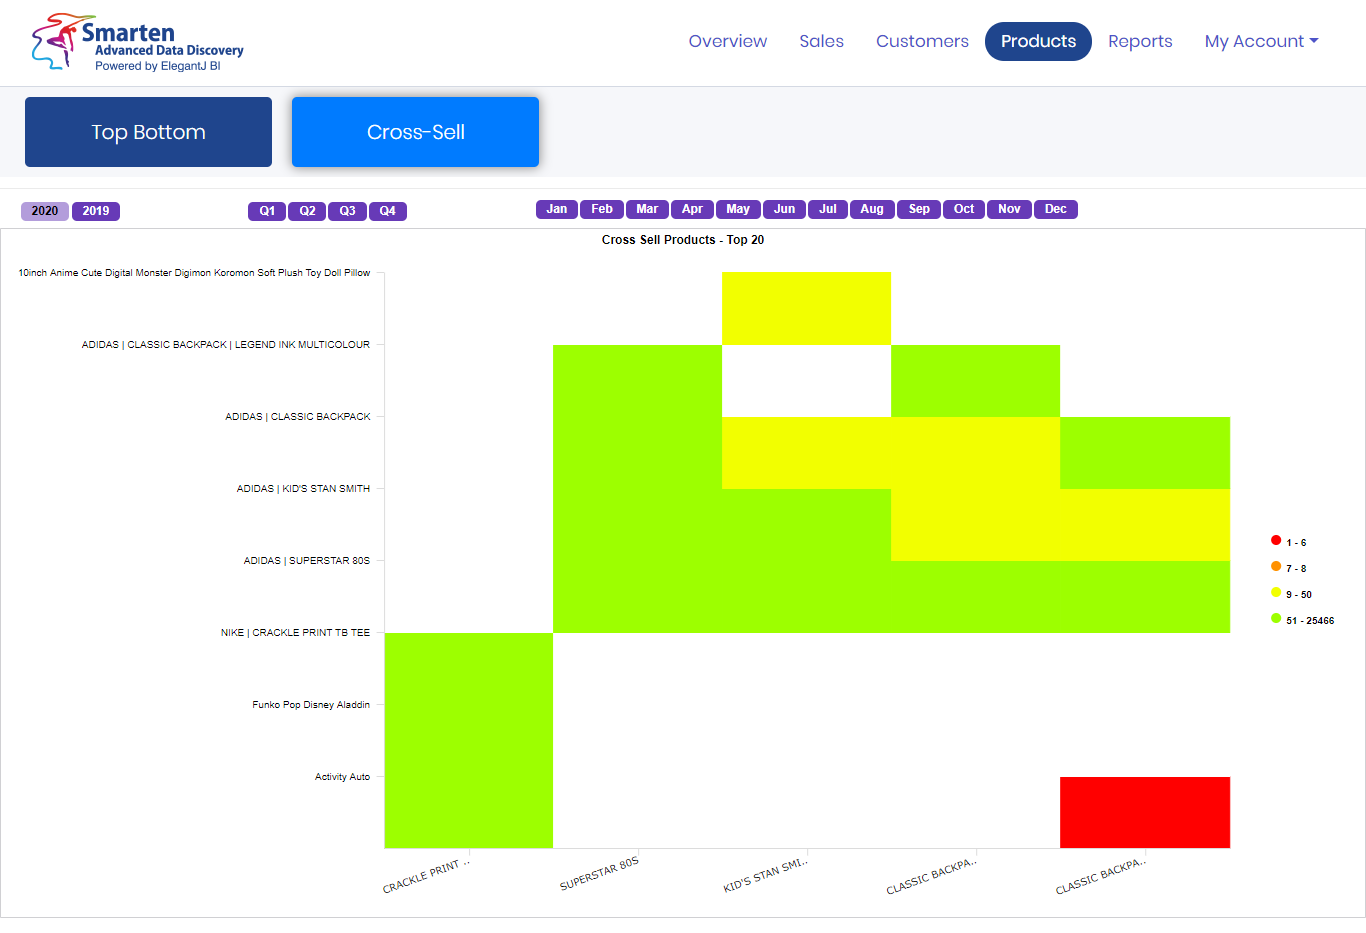
Product Cross-Selling
Problem: The business has taken a hit or miss approach to cross-selling and, while some products seem to sell well together, the business team would like to identify product cross-selling options with more certainty so it can achieve dependable results.
Solution: The Product Cross-Sell dashboard provides detailed information on frequently bundled product ordered by customers, and reveals the maximum products sold in combination and the number of times these products are purchased together so businesses can create strategies for these, and future product bundles to satisfy demand and to create campaigns.
Customer Loyalty
Problem: A business struggles to identify individual customers it wishes to target and reward for loyalty, and create a process to understand which customers are unlikely to buy again, where it should invest its time and energy with discounts, specials or rewards, etc.
Solution: The SmartenApps dashboard allows the business to perform detailed, clear analysis of customers and understand their purchasing history, the number of orders the time period between orders, etc. Businesses can address and reward loyalty, anticipate orders and anticipate those customers that will leave or wait to buy, based on the availability of a discount or coupon, etc.
Explore our pre-built reports and dashboards and discover how these can help you address your own business use cases and achieve success!
Smarten: eCommerce Analytics for Shopify Pre-Built Analytics Features Include:

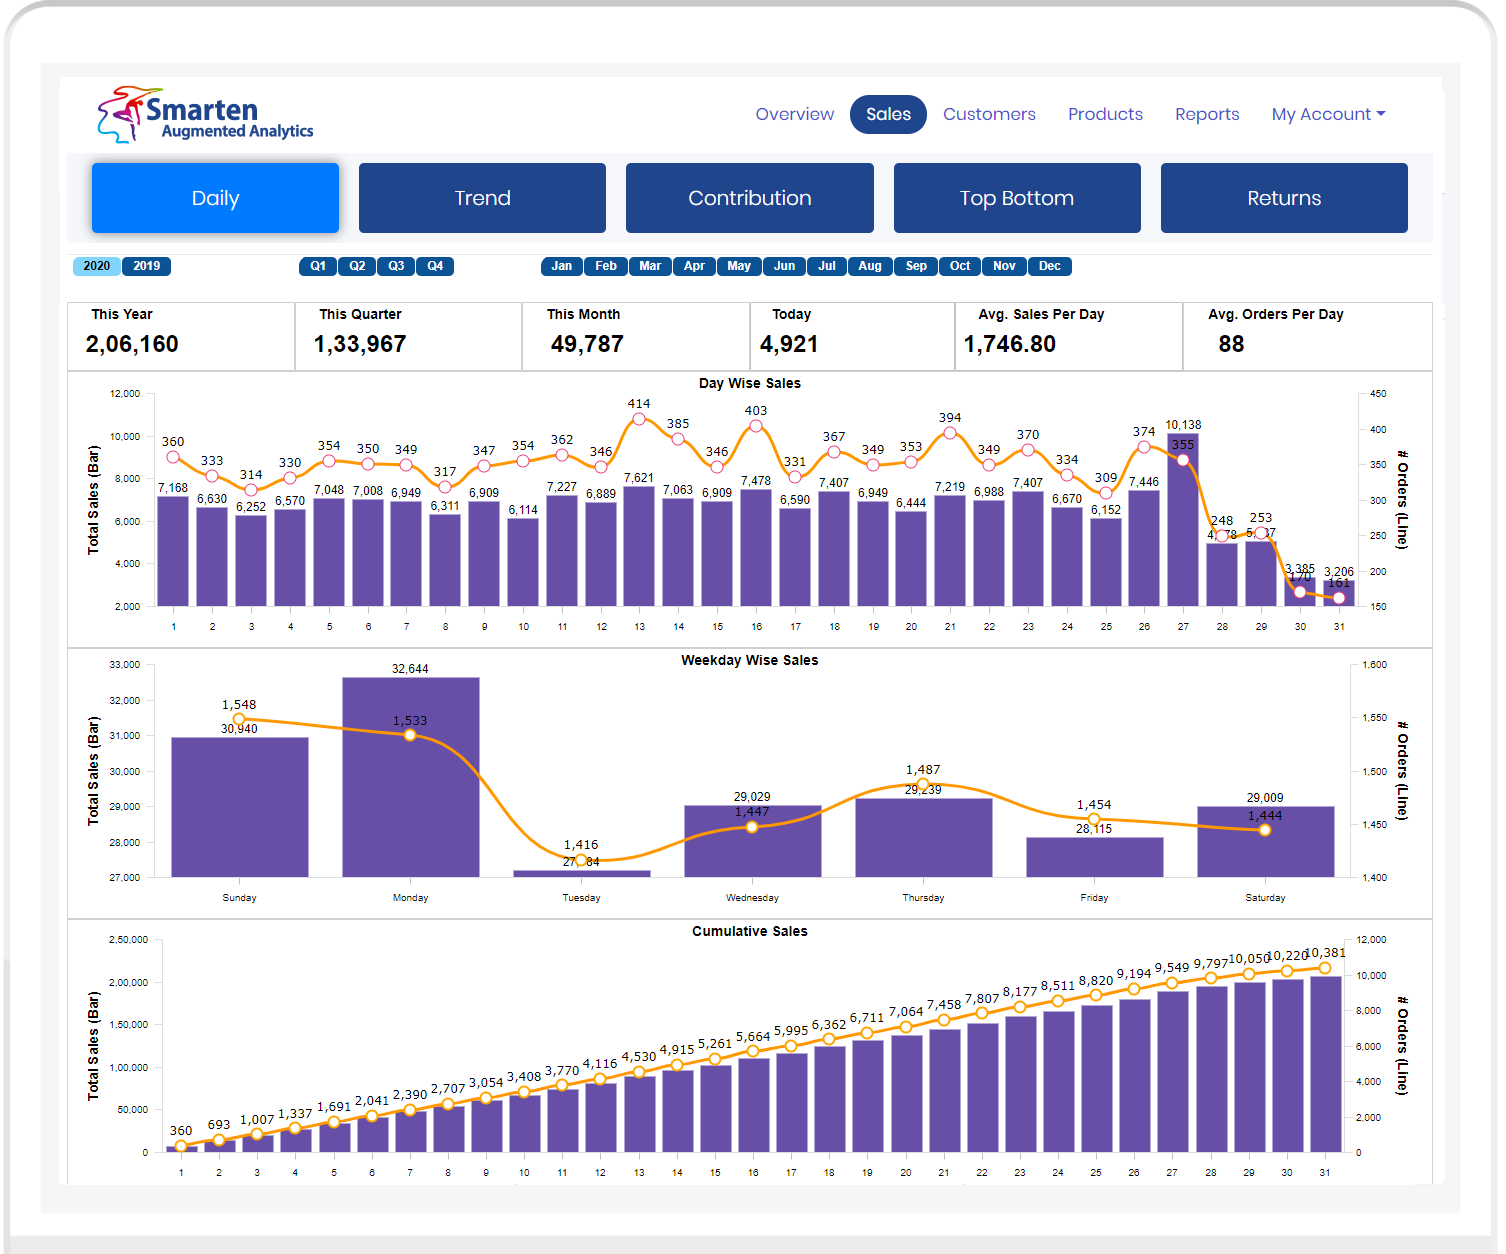
SALES OVERVIEW
Overview of sales performance including the number of orders, average order value per customer, gross, net and total sales and expenses for discount, shipping and taxes.

DAILY SALES TRENDS
KPIs, daily, weekly and cumulative sales to manage and monitor performance, and reveal performance by country, brand, customer. Monitors cart abandonment and recovery, product return by month, country, etc.

CUSTOMER DASHBOARDS
Track KPIs by customers, maximum orders, average customer order, and customer values, customers with the most returns.

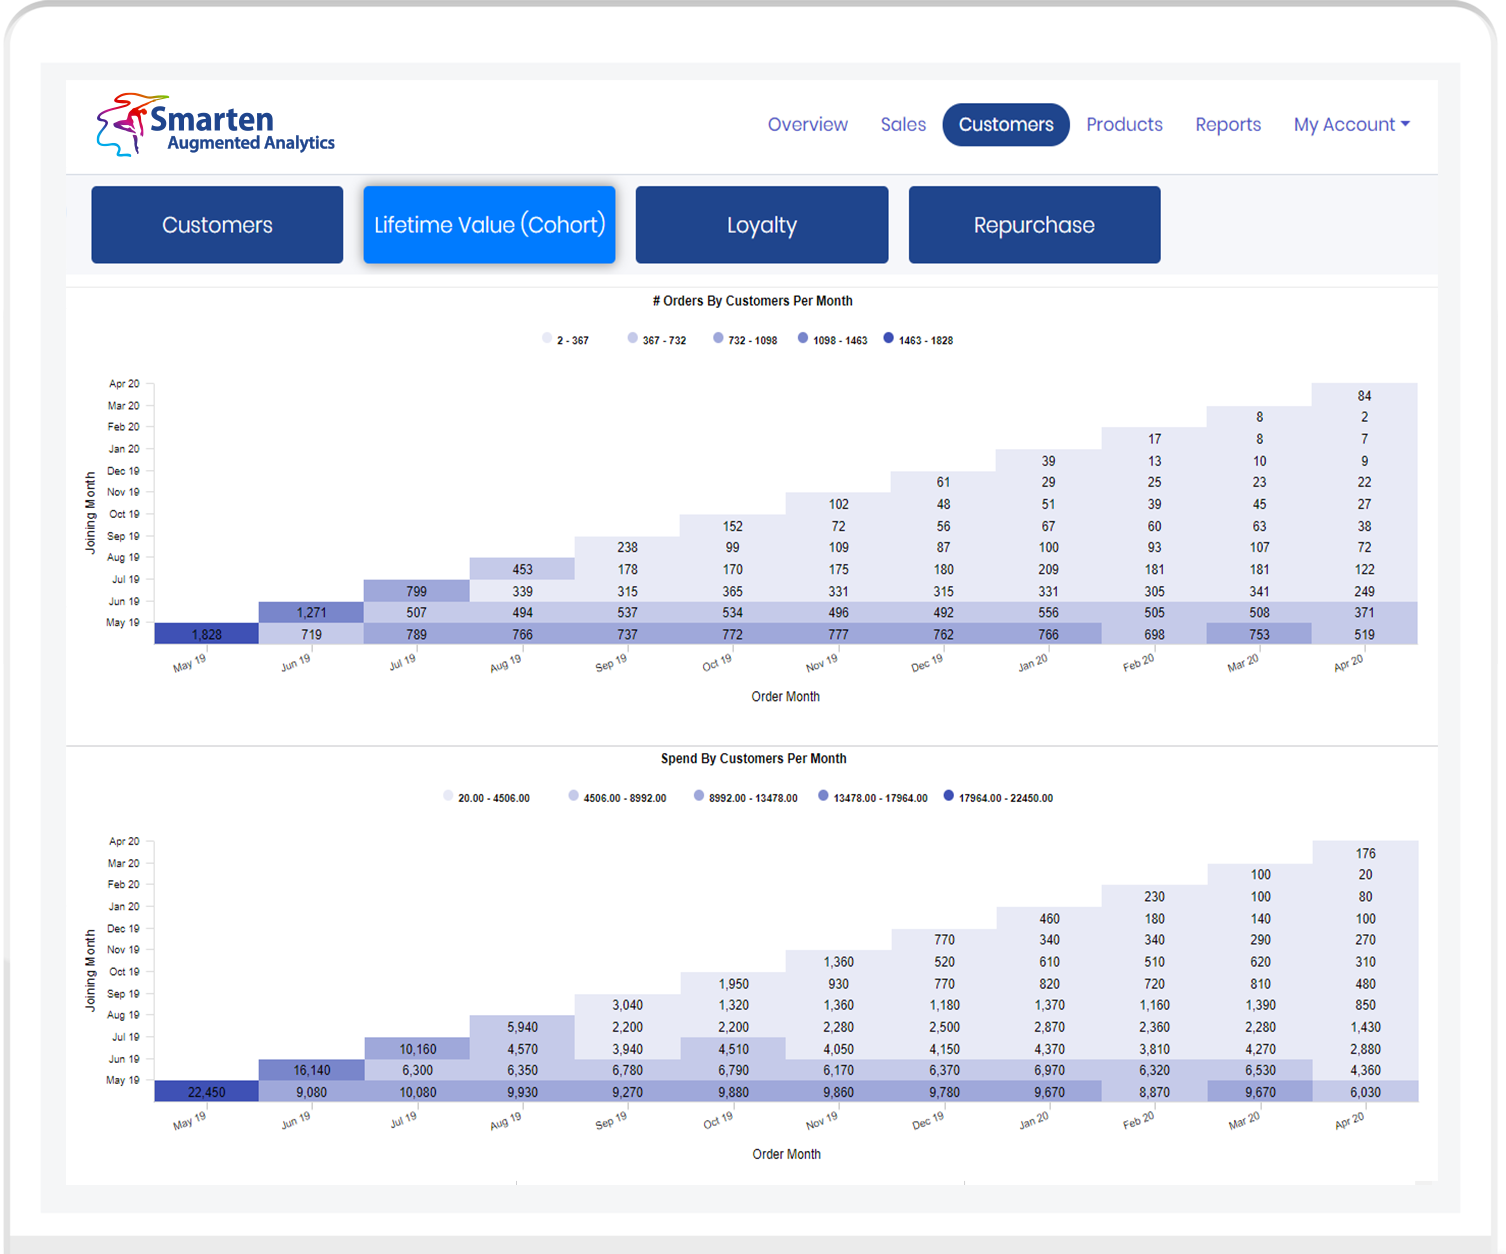
CUSTOMER LIFETIME VALUE
Users can track orders per month placed by a set of customers, and the value. Determine how long a customer stays on the site, and the lifetime value for a period. Understand customer loyalty, and identify customers who ordered the most items, and the period of time during which orders were placed.

PRODUCT DASHBOARD
Review and manage data regarding most frequently ordered products, brands, product variables, etc.

BI REPORTS
All dashboards allow for drill down analysis, and offer ready-to-use reports to view and export data, using CSV.
– Sales by Country, Brand, SKU, Customer and Source
– New vs Returning Customers by Country
– Merchants can request new reports at additional cost
Smarten: eCommerce Analytics for Shopify Sample Analyses
Business Intelligence You Can Use!
KPIs, Daily, Weekly and Cumulative Sales to manage and monitor performance.
Group marketing and demography subjects to reveal characteristics and reflect spending for a period of time or a customer type or group
Analyze customers based on number of orders, and time period of purchases to identify inactive, lay on the line, loyal, firm, anticipating, leaving and new customers
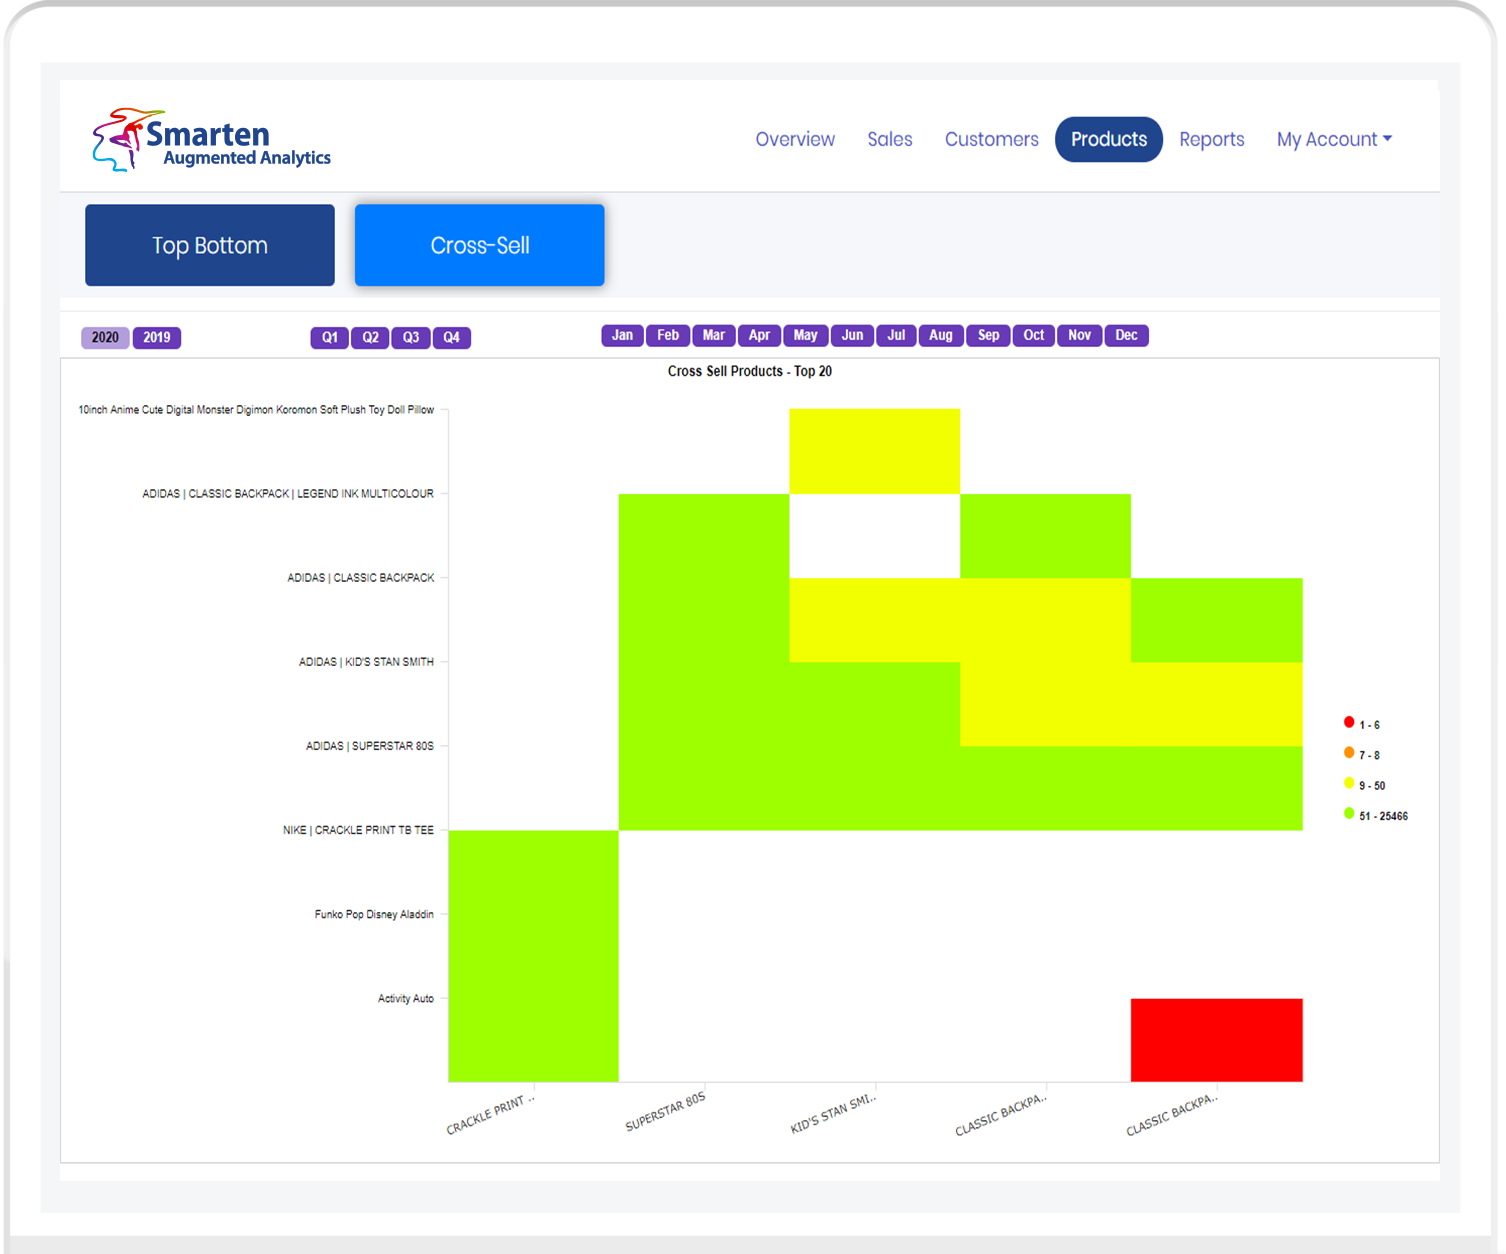
Reveals products frequently bundled by customers, the maximum products sold in combinations and number of times they are purchased together
Smarten: eCommerce Analytics for Shopify FAQs
It’s simple! All you have to do is
- Complete the intake form to subscribe. Our team will contact you.
- Within one (1) business day your account will be established, and the data synchronization process will be completed, and
- Get started!
When you sign up for the 7-day free trial you will have access to the Smarten: eCommerce Analytics Silver Package. At any point during the 7-day free trial, you can choose a subscription and email us at sales@SmartenApps.com to begin your subscription plan. You will not be billed until your 7-day free trial ends. Throughout the period of your paid subscription plan, you will be billed annually in advance (the most cost-effective plan) or monthly, as you choose.
You can cancel your SmatenApps subscription at anytime simply by sending us email at sales@smatenapps.com. You will not get refund for the remaining subscription period.
You can upgrade your subscription plan at anytime, simply email us at sales@smatenapps.com
If you have an order volume above your plan limit (Silver = less than 5,000 order, Gold = less than 15,000 orders, Platinum = more than 15,000 orders), you may continue using the Smarten: eCommerce Analytics app on the existing subscription plan, but it will only fetch and display data for the number of orders/customers provided by your plan.
For example, if you subscribed to a Silver Plan which stipulates 5,000 or less orders, and you exceed that with 8,000 orders, your dashboard and reports will only display orders/customers up to the 5,000-order threshold.
Orders
Number of Orders
Units per Transaction
Average Number of Items Purchased per Order
Average Order Value
(Total Value of Orders - Discounts – Refunds + Taxes + Shipping Cost) / Number of Orders
Gross Sales
Total Value of Orders
Discounts
Total discounts applied to orders
Returns
Amount refunded in orders
Net Sales
Total Value of Orders - Discounts – Refunds
Shipping
Total Shipping Value to Orders
Taxes
Total Taxes
Total Sales
Total Value of Orders - Discounts – Refunds + Taxes + Shipping Cost
Avg Sales Per Day
(Total Value of Orders - Order Refunds) / Number of Orders
Average Orders Per Day
Number of Orders within a specific time period / Number of days within that period
Customers
Number of Customers who have placed a minimum of 1 order
Average Customer Value
Total Amount of Orders / Number of Customers who have placed a minimum of 1 order
Average Order Per Customer
Number of Orders / Number of Customers who have placed a minimum of 1 Order
Gross Revenue
Total sales after discounts, but before refunds, shipping, and taxes.
Gross revenue = Total sales – Discounts
Net Revenue
Total sales after discounts and refunds, but before shipping and taxes.
Net revenue = Total sales - (Discounts + Refunds)
*Smarten:
eCommerce Analytics will always use net revenue where applicable.
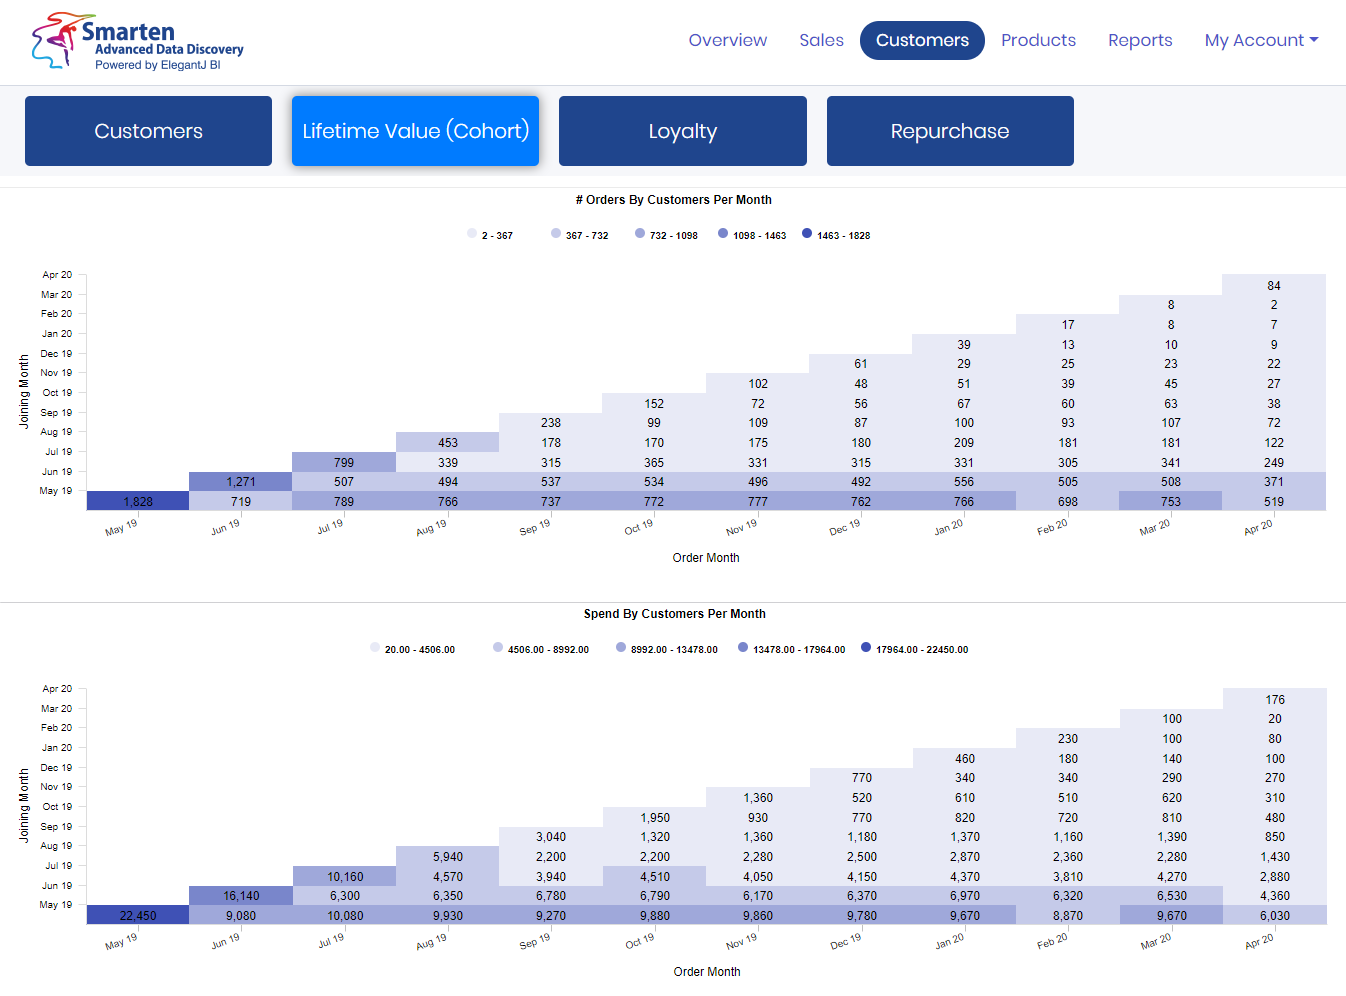
In the field of statistics, marketing and demography, a cohort is defined as ‘a group of subjects who share a defining characteristic’. The example above displays Cohorts for the number of Customers and for Customer Value. The graph on the left displays the customers who were joined in May-19, and shopped in May-19, Jun-19 and Jul-19, etc. The graph on the right displays the customers joined in May-19 spend 22,450 and the same set of customers with purchases 9,080 in Jun-19 and 10,080 in Jul-19. These graphs reveal patterns by displaying customers joined in a particular month and the spending history of those customers.
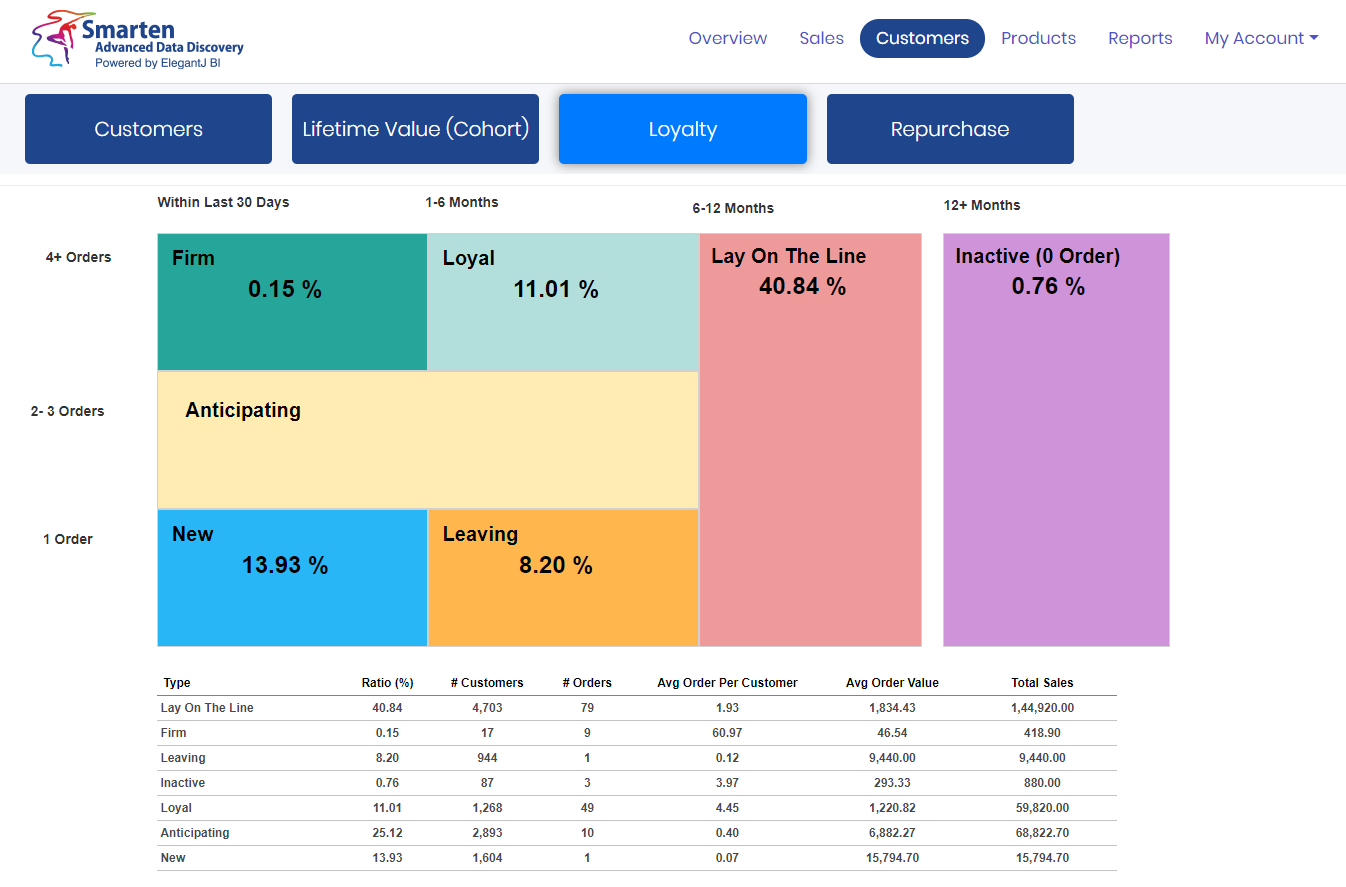
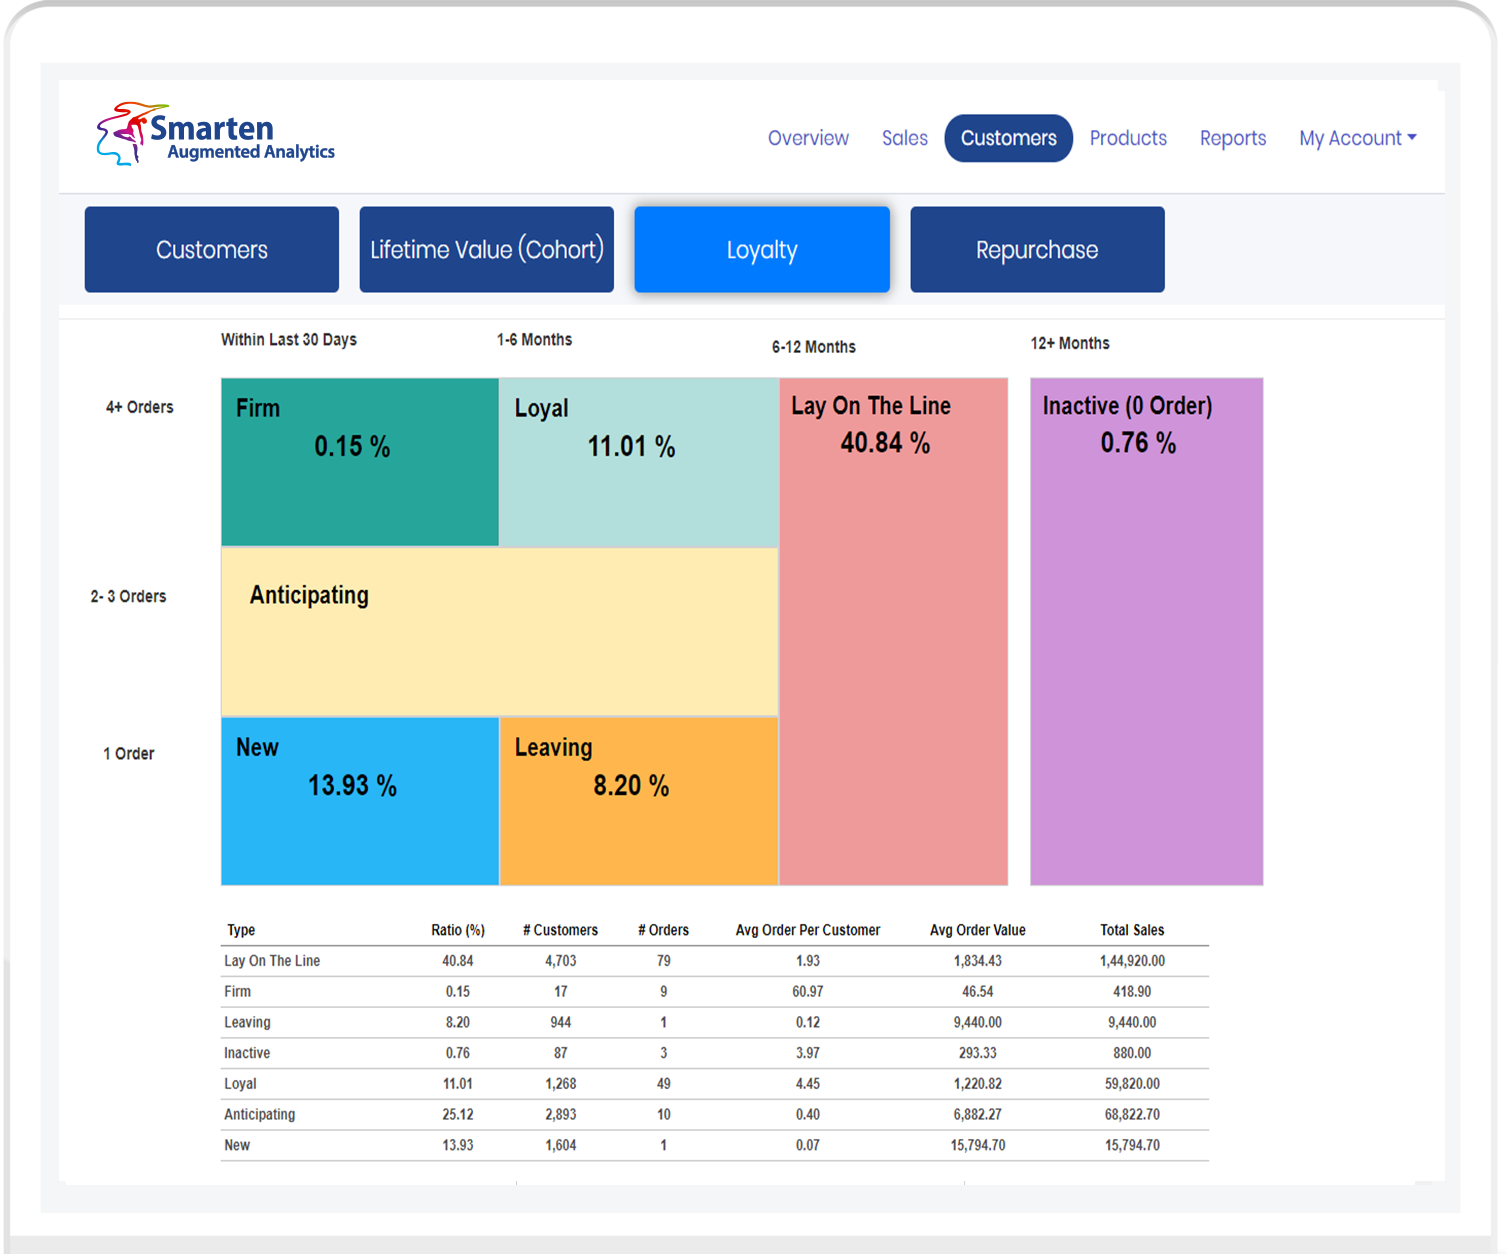
This graph defines the number of customers and the percentage of distribution based on the number of orders per customer and the period during which they made a purchase. Here, one can identify the customers who have not made a purchase within the past twelve (12) months identified as “Inactive”, as well as the customers who made a purchase within the past 6-12 months, identified as ‘Lay On The Line’ of becoming ‘Inactive’ and customers who purchased products within the past 1-6 months, bifurcated into ‘Loyal, Anticipating and Leaving’. These labels are assigned based upon the number of orders during that period. Customers who ordered within the past 30 days are identified as ‘New’ customers and, based on the number of orders they placed during that period, they are identified as ‘Firm’.
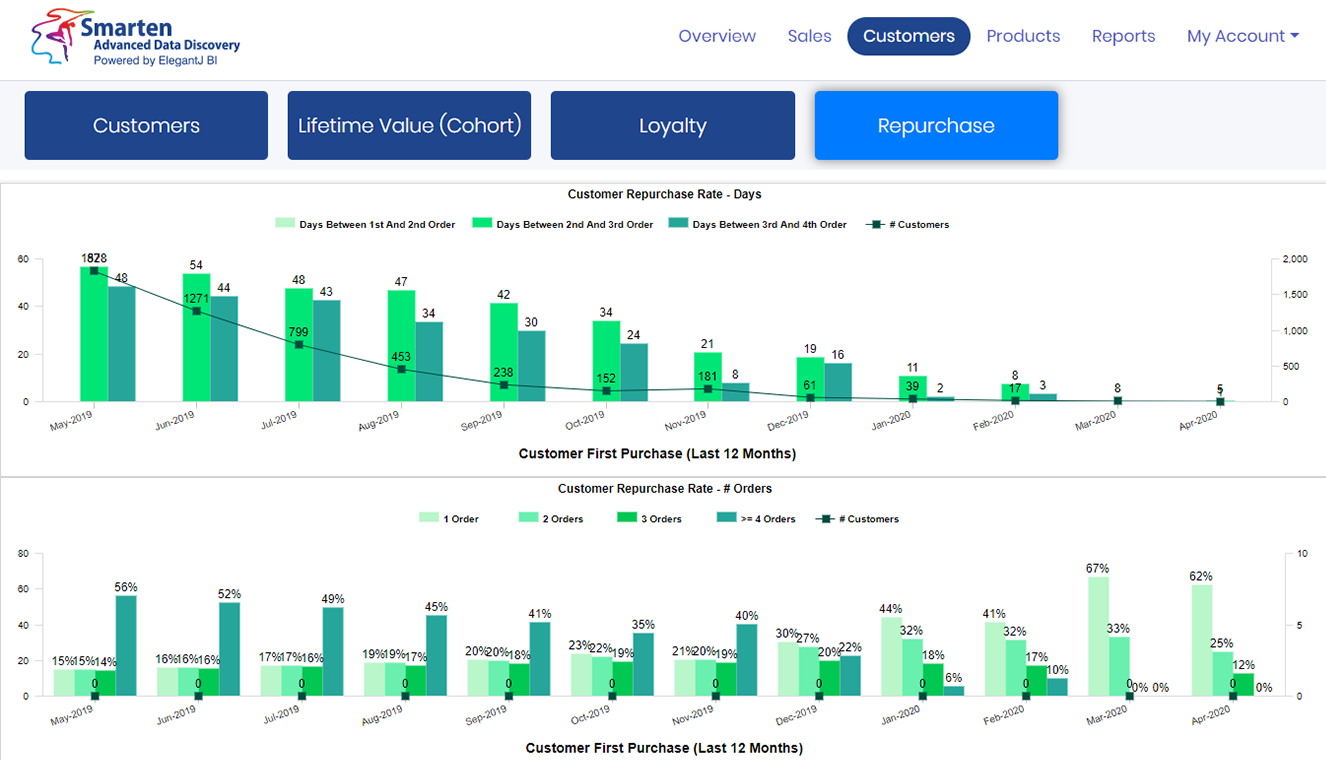
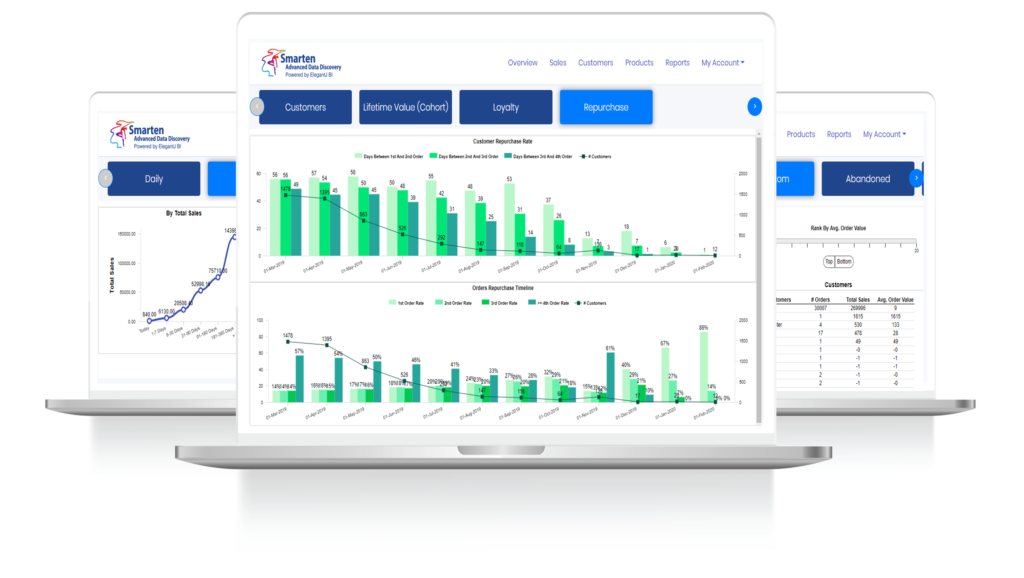
The graph on the top depicts the number of days gap between customer order ‘1’ and customer order ‘2’ and the gap between order ‘3’ and beyond. This graph highights the repurchasing capacity and reveals the number of customers per month. The graph below indicates the rate of ‘re-purchase’ for orders between 1 order and 2 orders, 3 orders and beyond.
While the Smarten: eCommerce Analytics subscription provides numerous reports, clients sometimes require additional reports or dashboards. Custom requirements can be addressed at an additional cost based on the requirement. Subscribers may Contact Us to discuss requirements.
If you reviewed our FAQ section and you still have questions, please feel free to Contact Us for support!
Smarten: eCommerce Analytics for Shopify
Modern Business Intelligence, BI Tools and KPI
Plans & Pricing
* All charges are billed in USD. Recurring charges, monthly or annually.
Smarten: eCommerce Analytics for Shopify offers unmatched value, swift implementation and adoption and a user-friendly, simple interface with pre-built reports and dashboards designed to provide insight and actionable business intelligence.
Your business can improve customer connection and focus, product and service sales and competitive stance. Don’t wait – our team is here to help!
Click Here to register for a free trial (7 days) or to subscribe.