
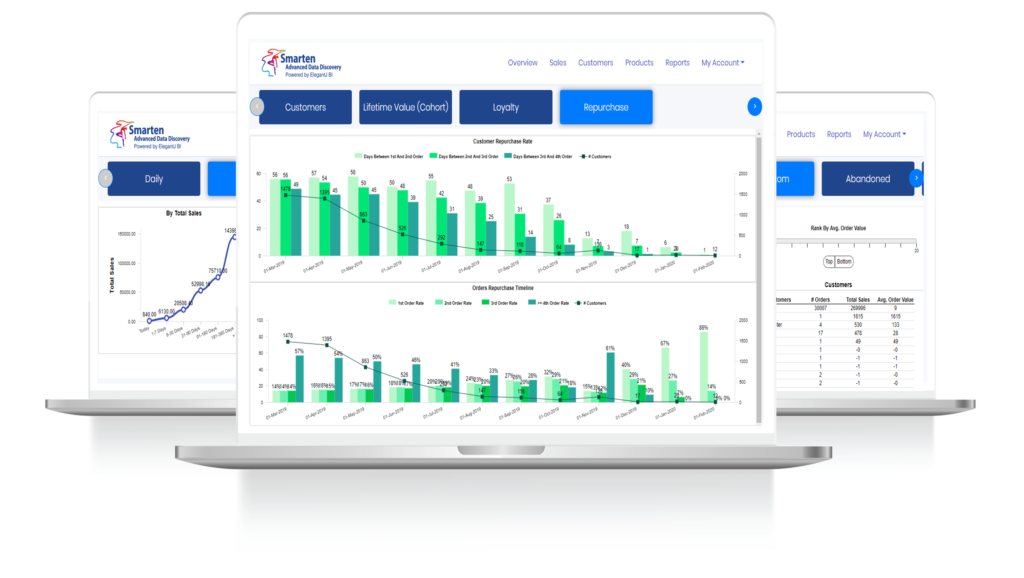
SmartenApps for Microsip®
Augmented Analytics and Modern Business Intelligence and Reporting Integrated with Microsip®
Data-Driven Decisions, Near Real-Time Access, Intuitive Analysis, Web and Native Mobile App Access
With SmartenApps for Microsip®, business users in the Mexico market gain access to BI for Microsip and insight into data contained within the Microsip ERP solution. Team members can analyze key business indicators with relevant data and intuitive analytics. SmartenApps for Microsip provides seamless analytics integration and fact-based decision-making.
SmartenApps for Microsip offers stunning visualization, dynamic charts and graphs, modern business intelligence features, KPIs and Geo Maps for detailed analysis.


![]()
Microsip is a Mexico-based ERP solution provider. Its ERP product controls the administrative and operational processes of Pymes. It maintains eight (8) regional offices and has more than 350 certified partners. Throughout its 35-year history, it has served the needs of 100,000 companies, maximizing the market presence and potential of its clients.
Smarten is accredited by Gartner and recognized for its intuitive, easy-to-use analytics, Smarten offers stunning visualization, dynamic charts and graphs, modern business intelligence features, and key performance indicators (KPIs) metrics to help you sustain a competitive edge.
IndicadoresPyME (iPyme) is a Mexico-based IT consultant with more than a decade of experience in business consulting with a focus on information analysis, and has served more than 500 clients in industries such as manufacturing, production, retail, etc. It is committed to leveraging innovative technologies to support the growth of Micro, Small and Medium Enterprises in México – known as ‘Pymes’, and has partnered with Microsip to provide technology solutions to support its clients.
Benefits of SmartenApps for Microsip Business Intelligence
- Users have near real-time access to recent transactions and data
- Web and Mobile access allows for intuitive analysis
- Users can access the SmartenApps for Microsip using a web and native mobile app user experience
- Start-up is easy, within a few minutes
SmartenApps for Microsip provides deep dive analytics with Dashboards and Reports that include Sales Overview, Sales Contribution, KPI Analytics, Top-Bottom Analysis, Receivables and Payables Analysis, Collections, and exhaustive reports related to sales performance, receivables and payables, inventory etc.
How It Works
The SmartenApps for Microsip is founded on elegant, simple and secure technology and architecture.

- On-premises Microsip® installation is connected to the Desktop App.
- Desktop App connects to secured cloud server to push data at predefined frequency.
- The Native mobile app and Web app communicate with the Cloud server to fetch and display required data, graphs and reports.
- All interaction and transactions are secure.
SmartenApps for Microsip Analytics Solution Overview – Web Interface

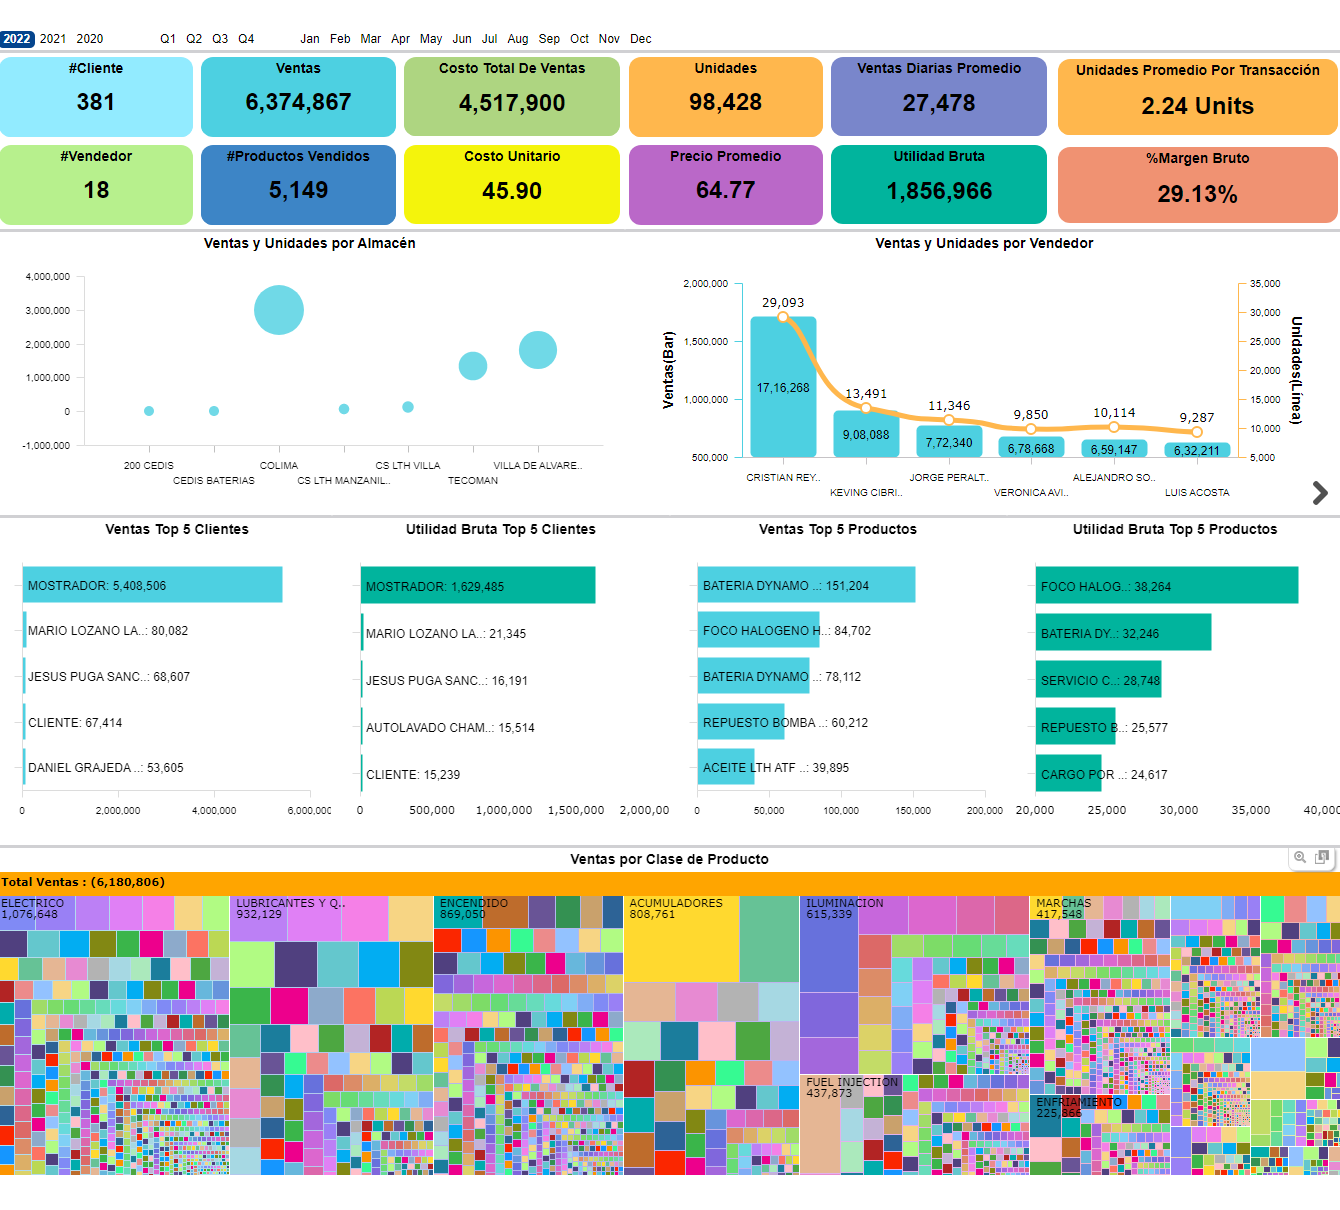
SALES OVERVIEW
Overview of Key Sales Indicators, e.g., number of customers, sales, cost of goods sold, sales and gross profit by customer and by product. Reports include annual branch sales and units, vendor sales and units with invoice level sub-view.

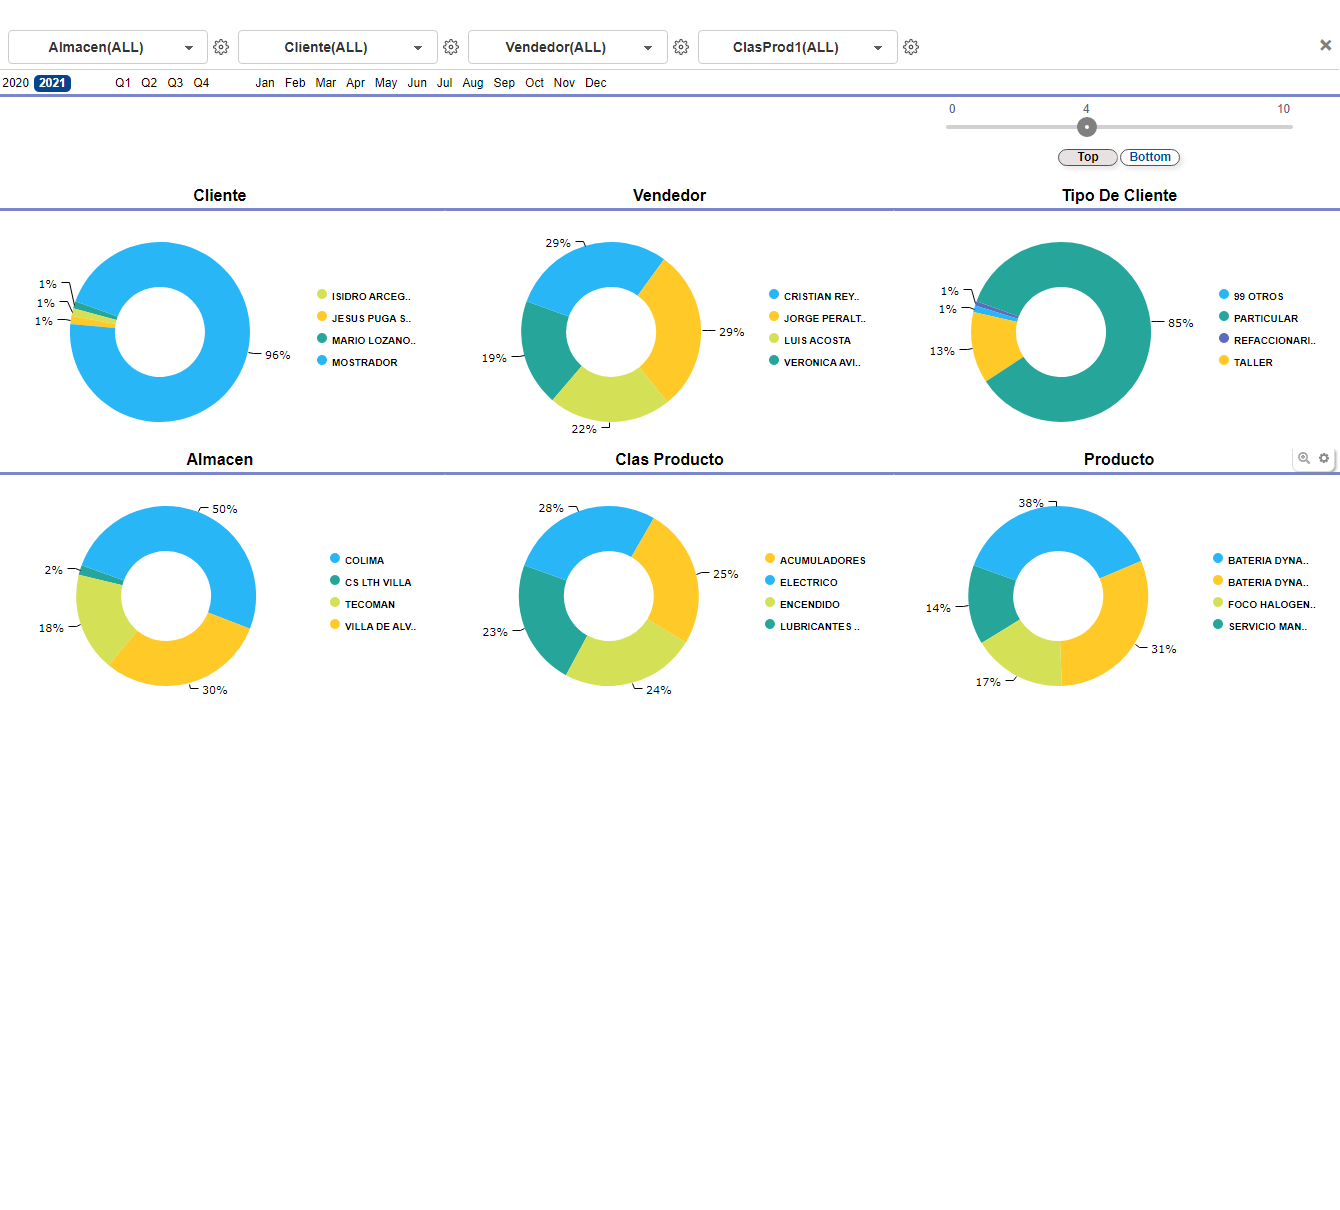
SALES CONTRIBUTION
Contribution of sales by customer, vendor, branch, product, product category. Analyzing top and bottom contributing factors.

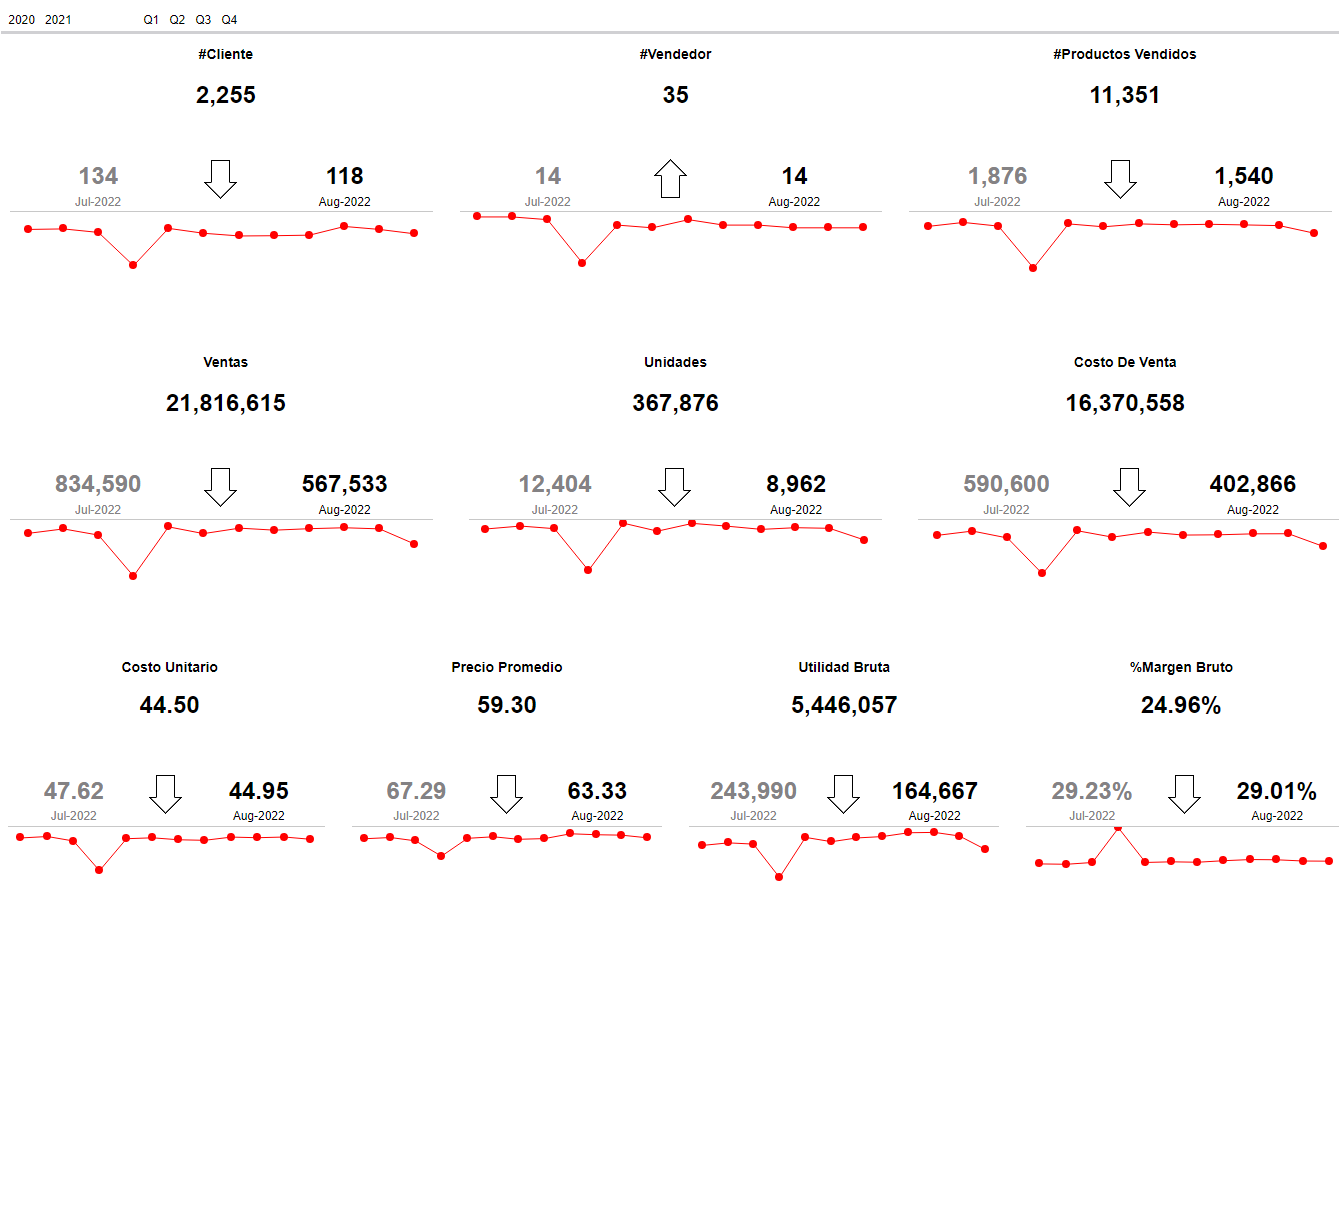
SALES KEY PERFORMANCE INDICATORS (KPIs)
Analyze total number of customers and trends for the past 12 months, number of vendors and trends, number of sold products and trends, gross profit and trends.

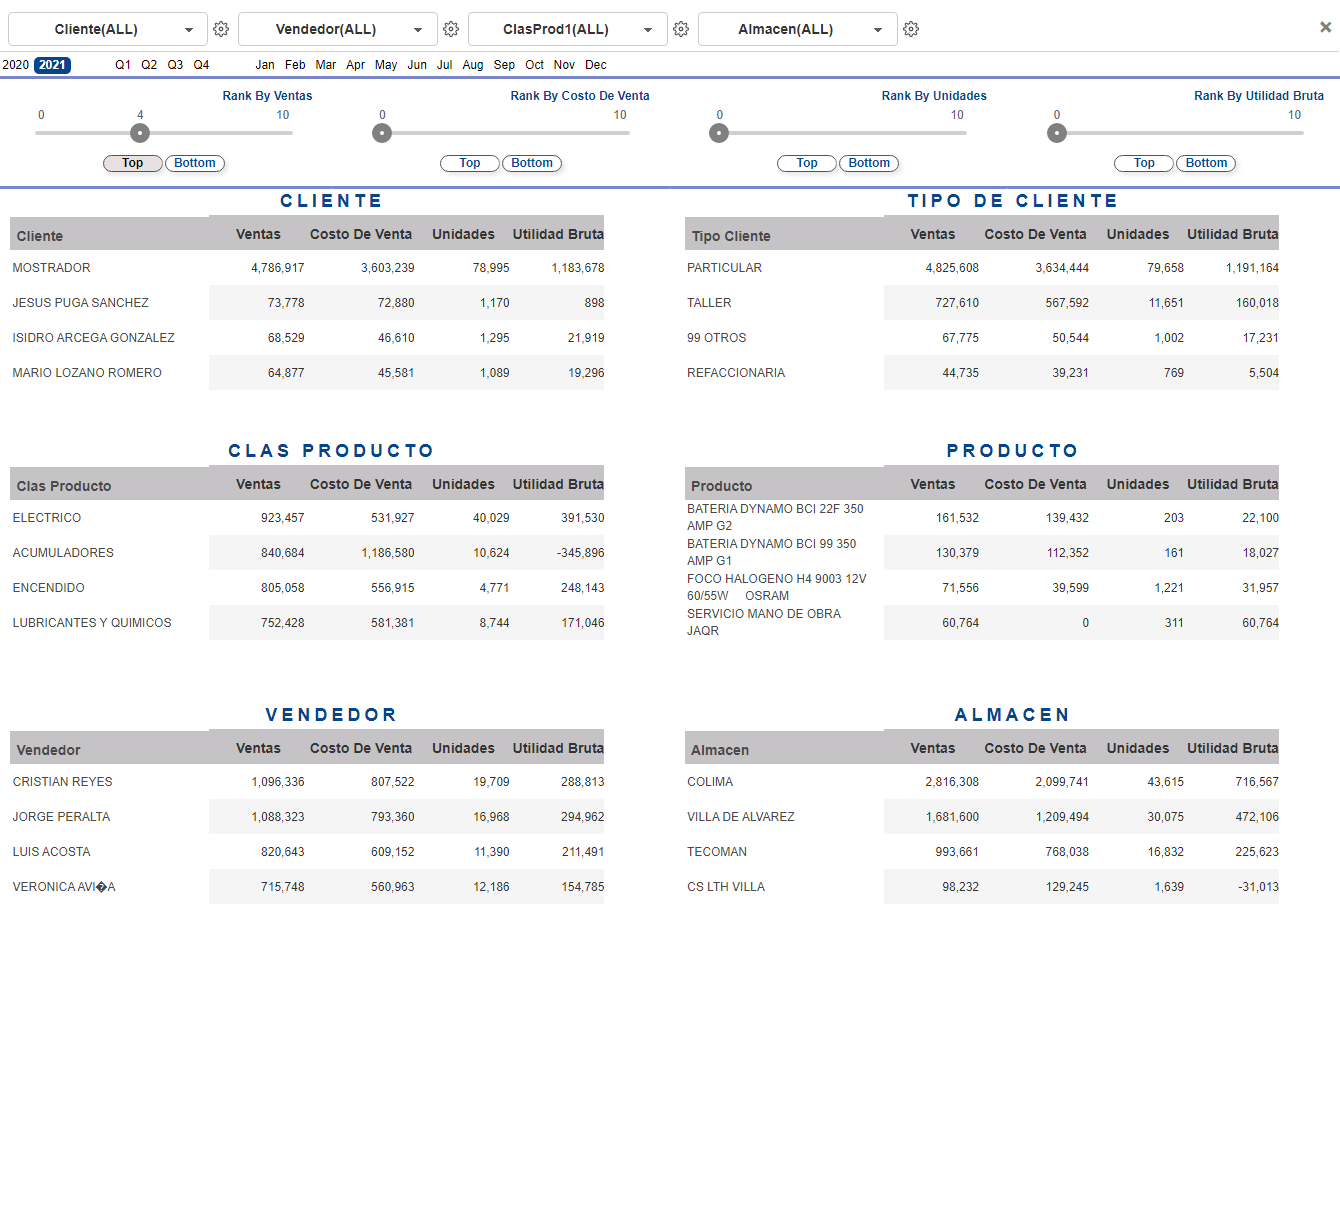
TOP BOTTOM ANALYSIS
Analyze Top and Bottom customers, products, vendors, branch with sales, cost of goods sold and gross profit.

SALES GEOMAP
Branch sales illustrated on Google Maps.

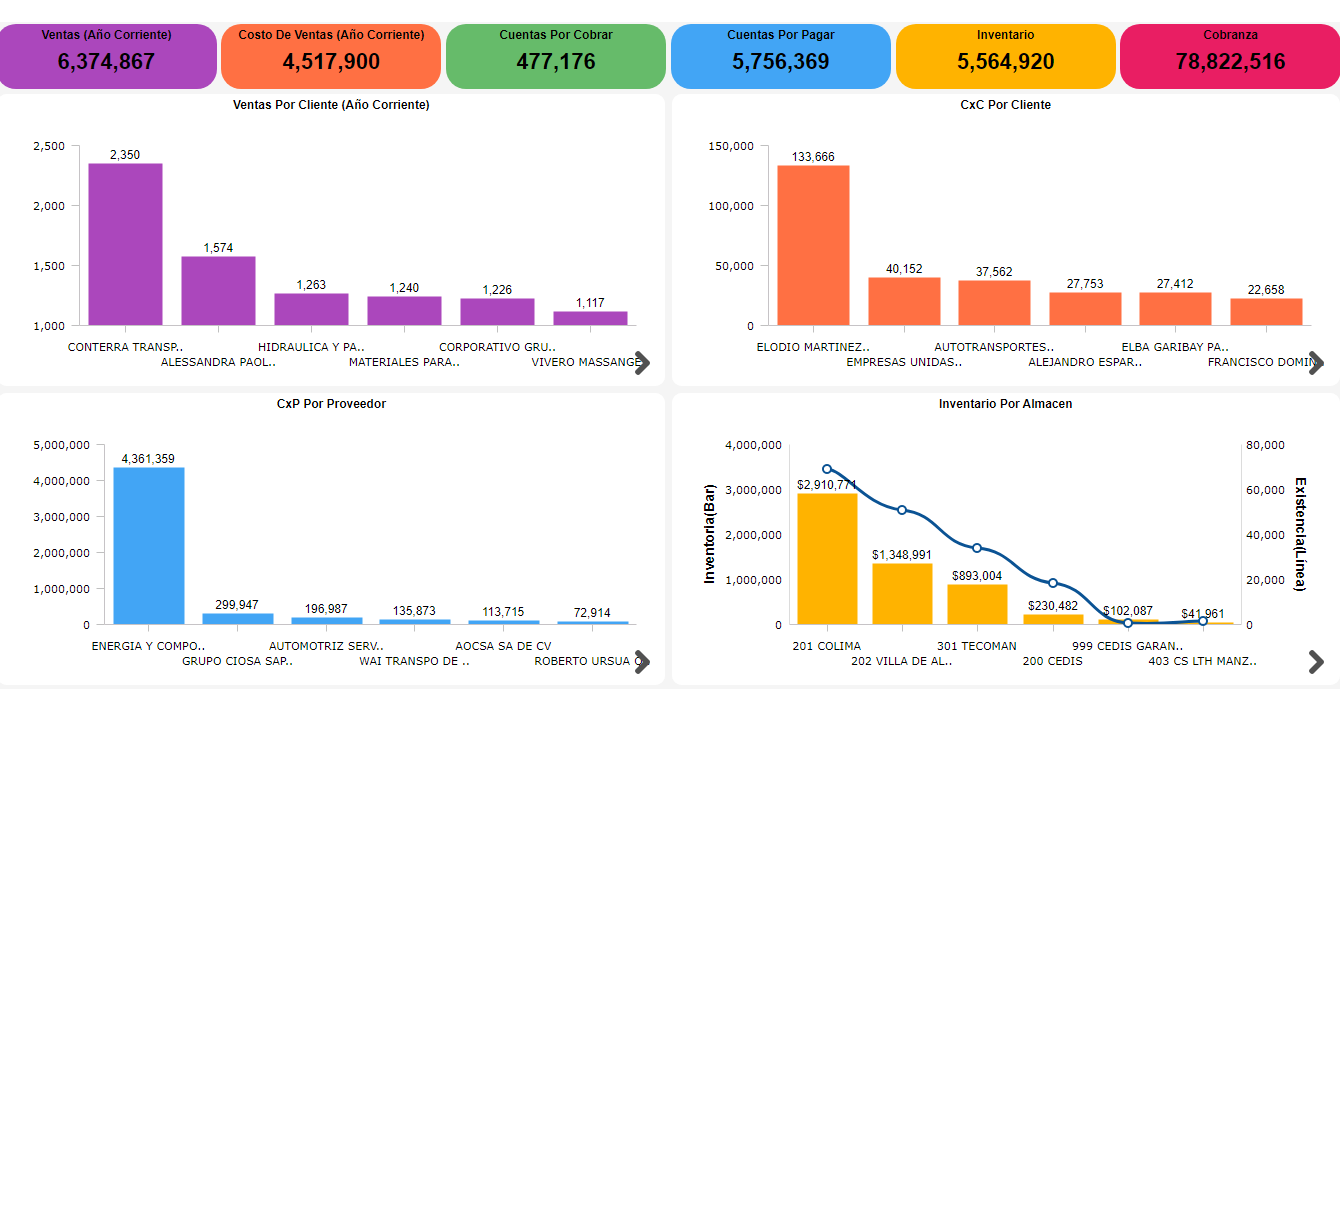
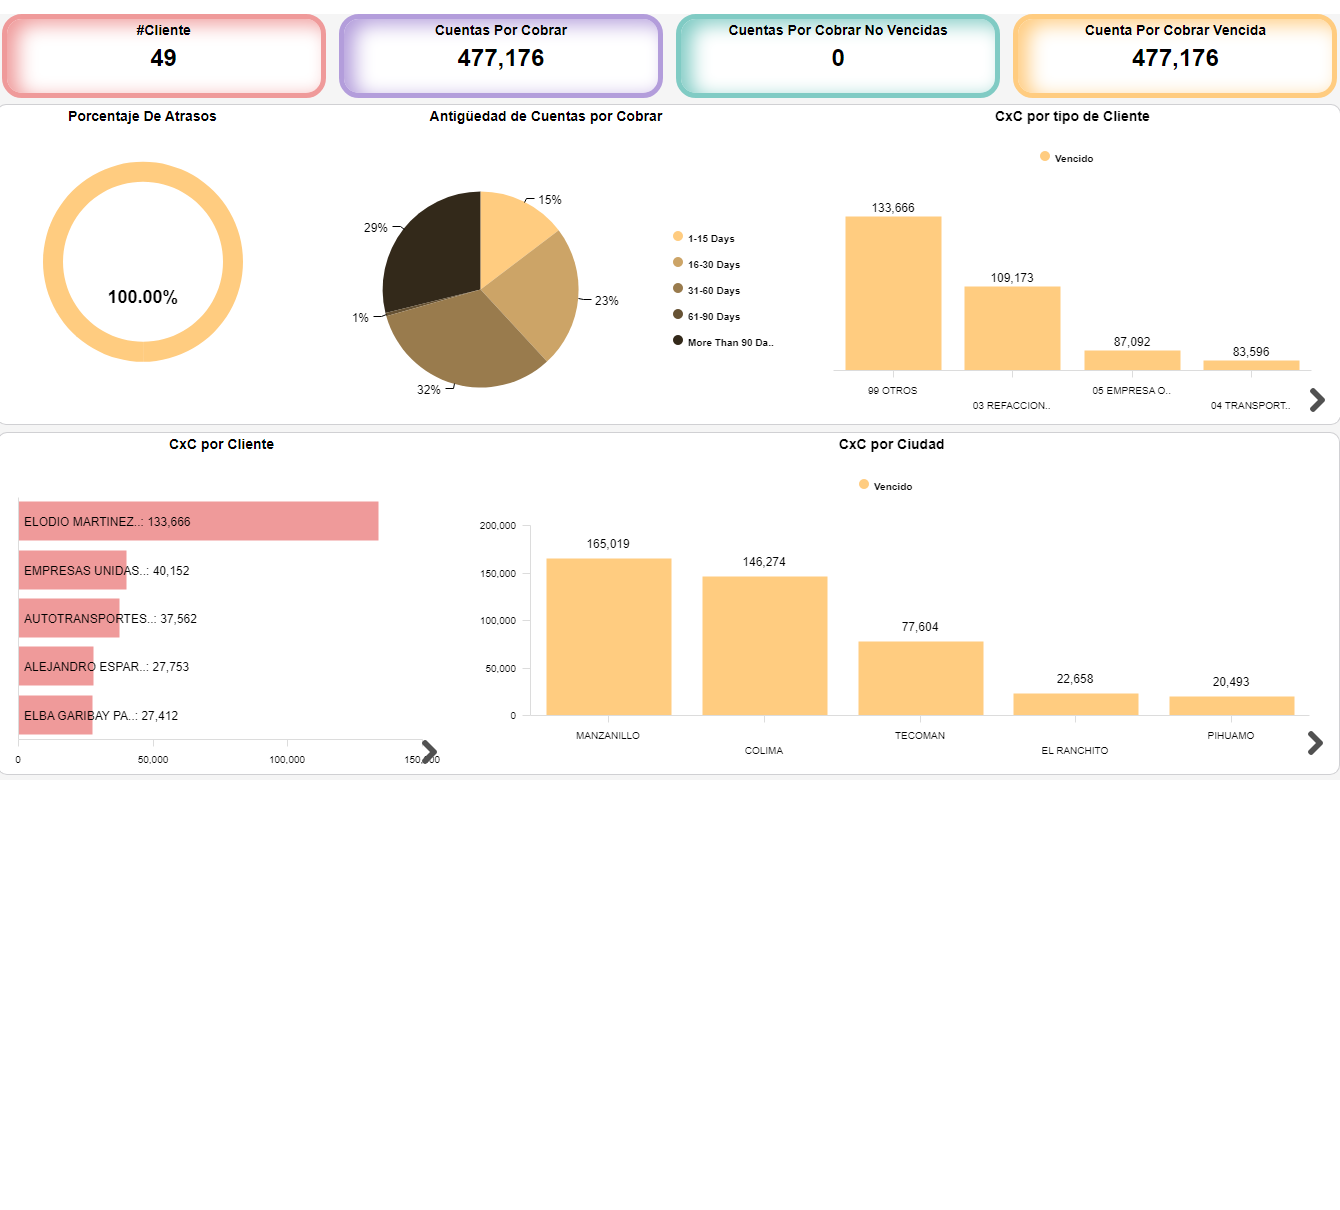
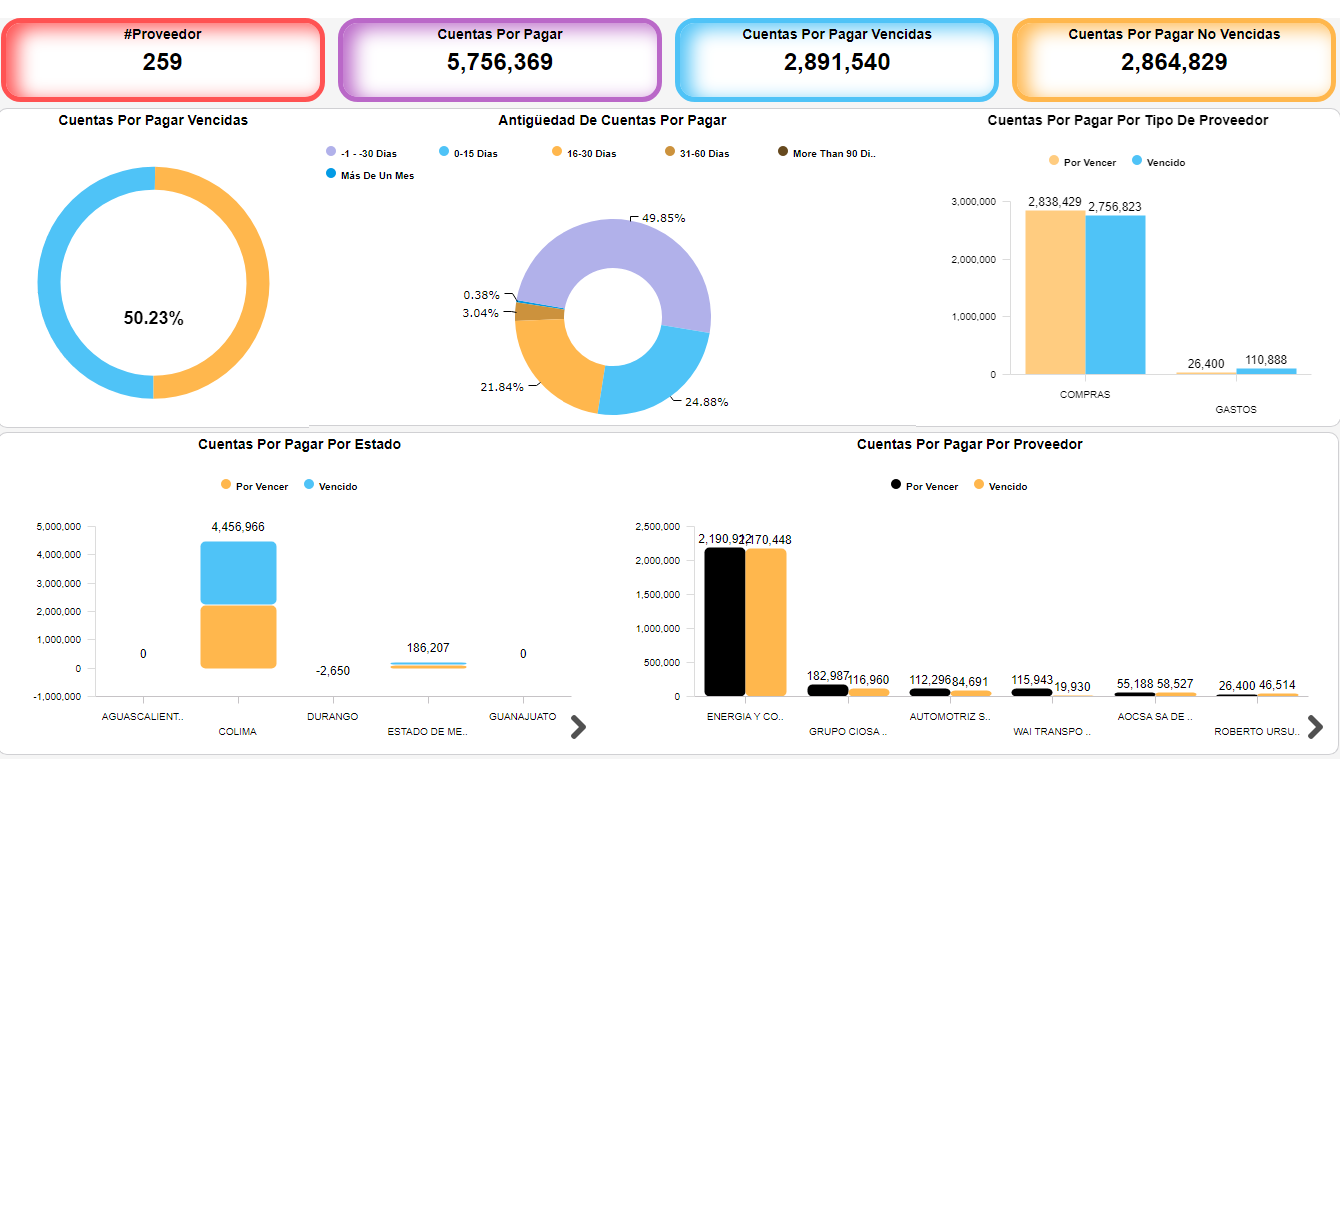
ACCOUNTS PAYABLE AND RECEIVABLES
Breakdown of payables and receivables by creditors and debtors, as well as by products, services and components. Analyze trends for overdue collections.
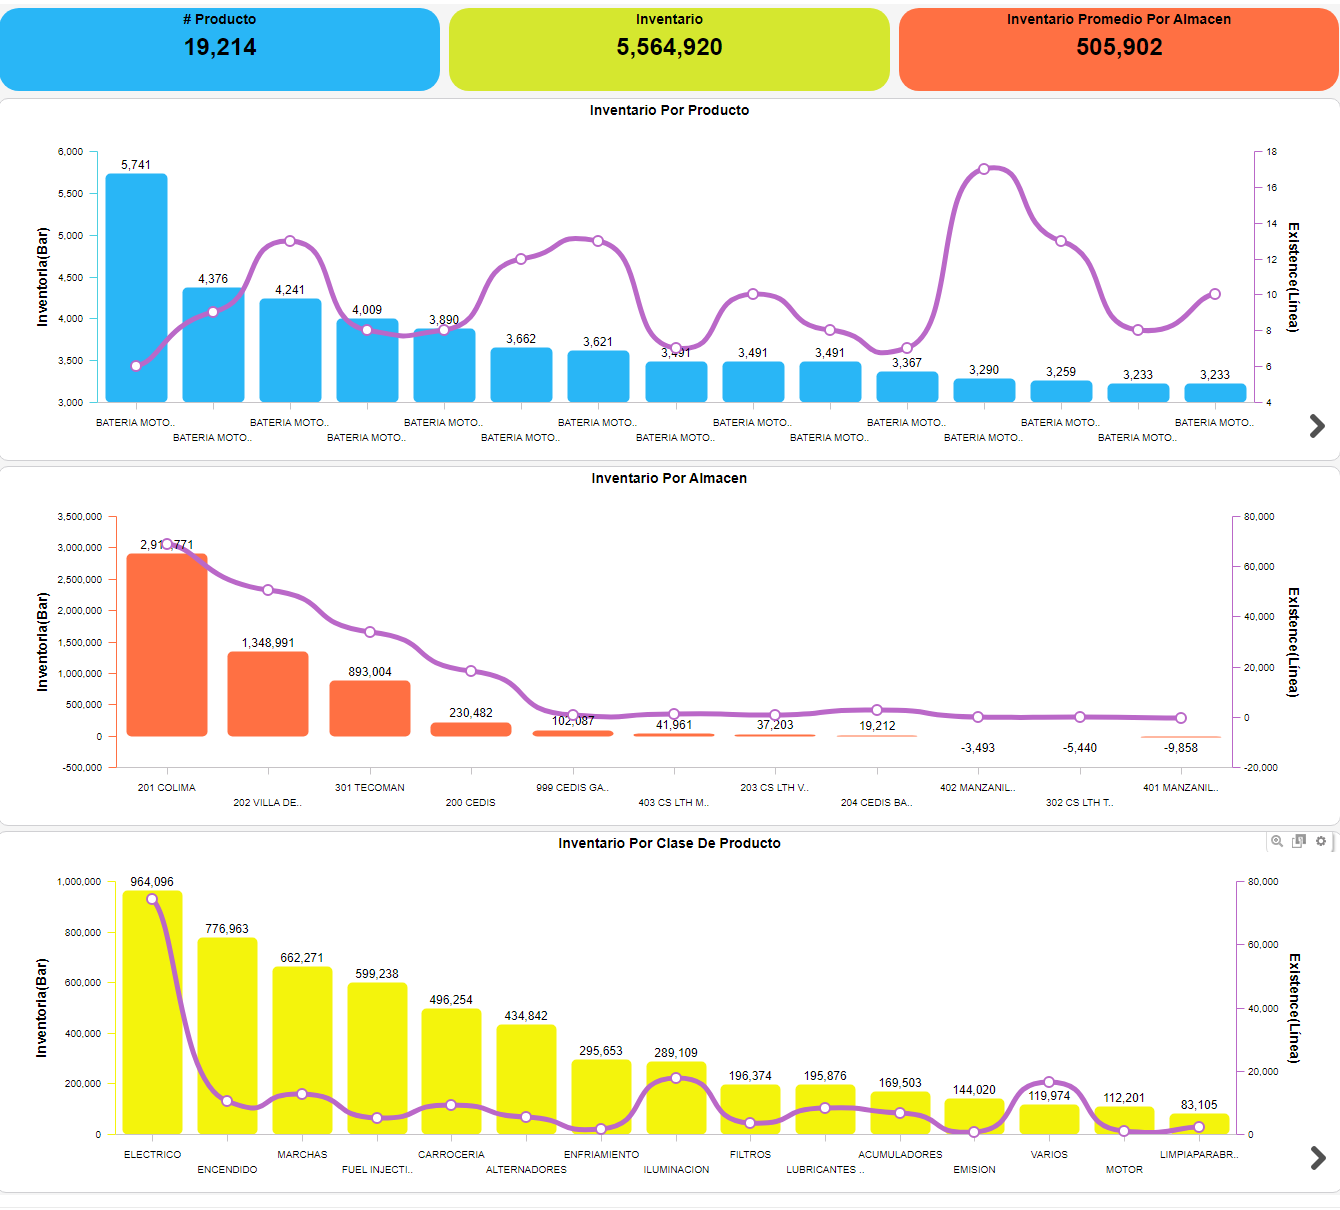
INVENTORY
Analyze inventory for stock across warehouse and product categories.
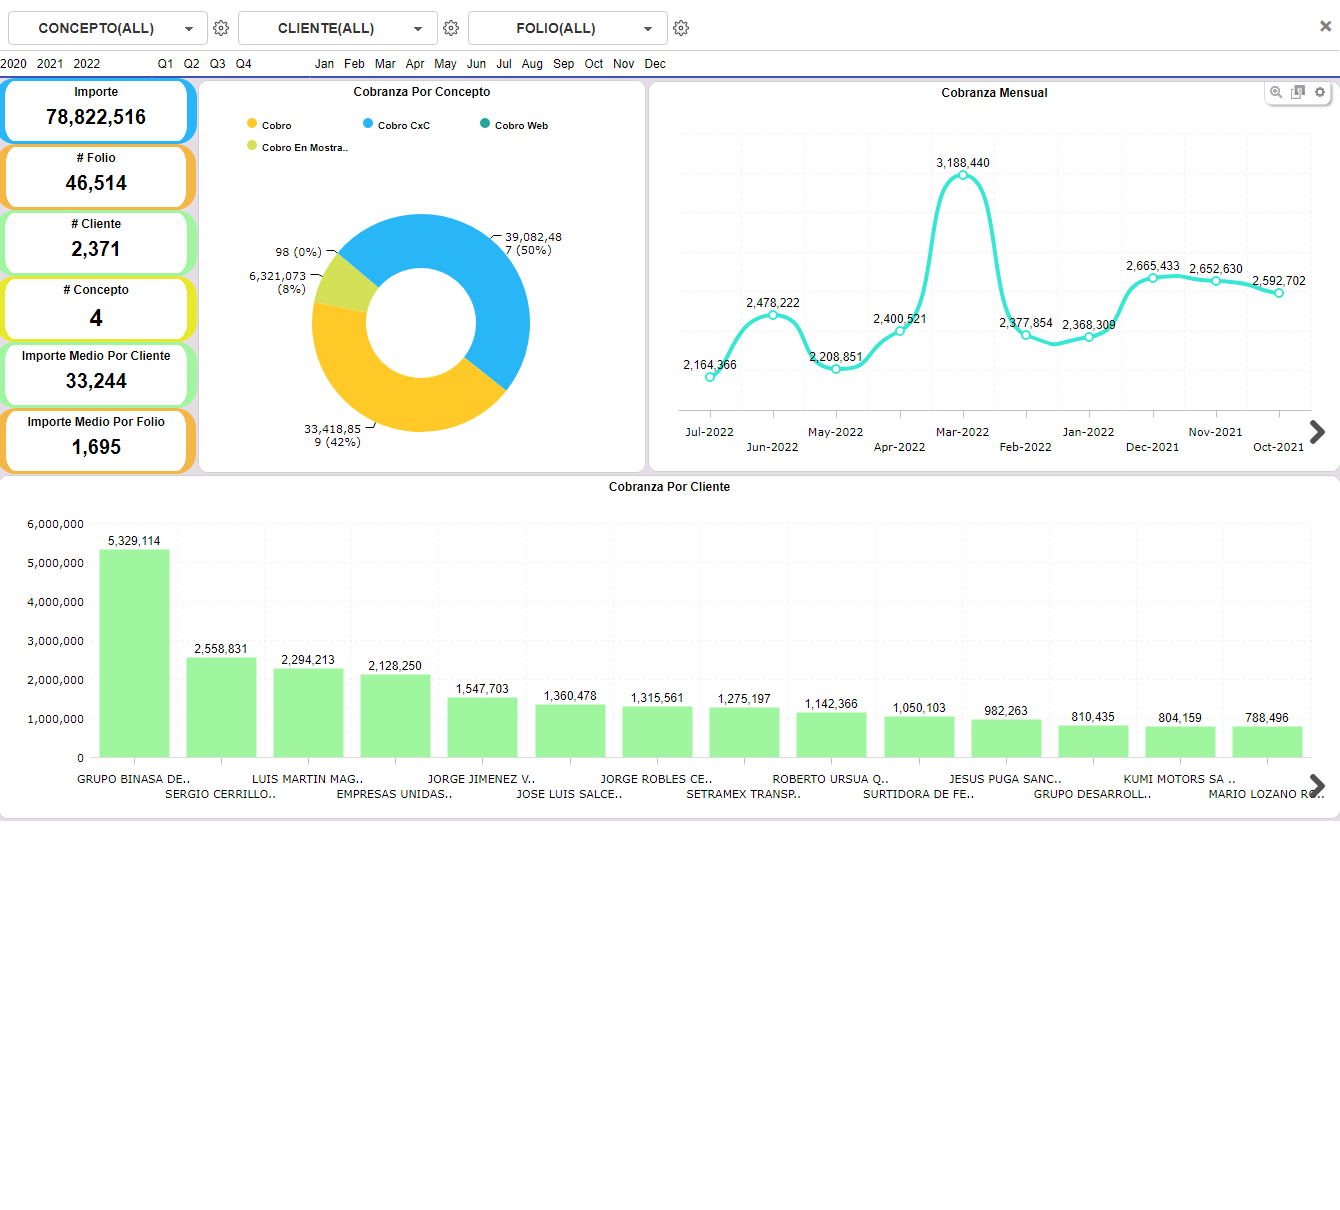
COLLECTIONS
Analyze collection by customer, monthly collections, collection by concepts and folios.
REPORTS
Various interactive reports with drill-down to slice and dice data by product, service, cost, sales person, receivables, payables, customer, inventory, purchasing, costs, sales by previous month and cumulative etc.
To find out more about SmartenApps for Microsip, or to schedule a demo or installation or to speak with a sales representative contact IndicadoresPyME at ventas@ipyme.mx, or call +52 33 2343 8381 for more information.